Candle High Low Exit
$0.00
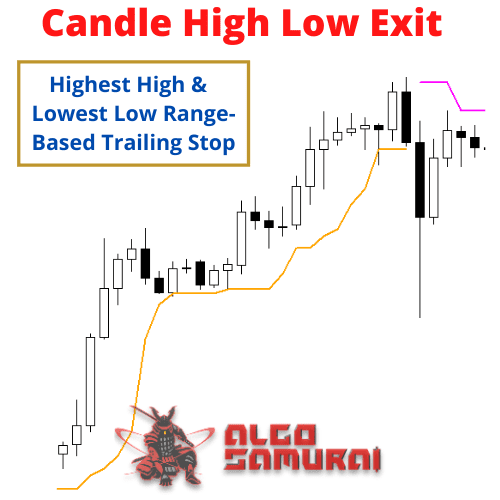
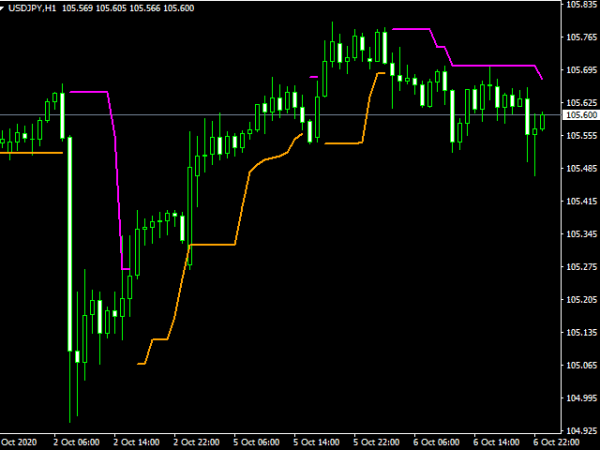
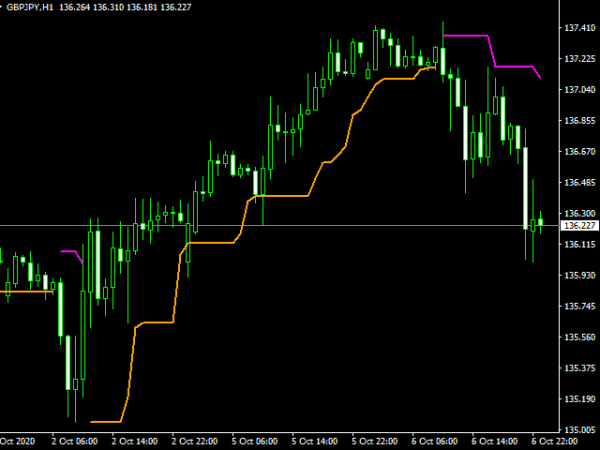
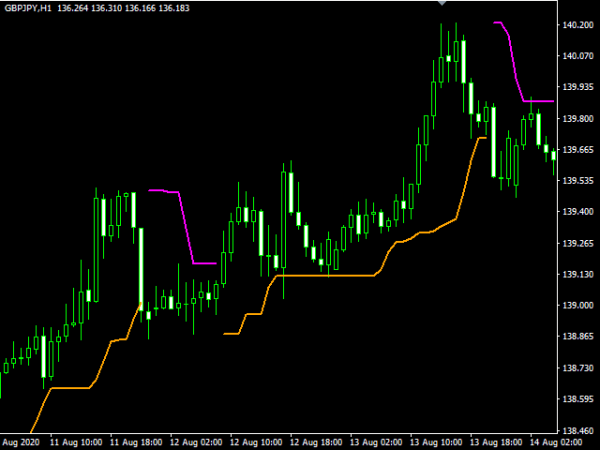
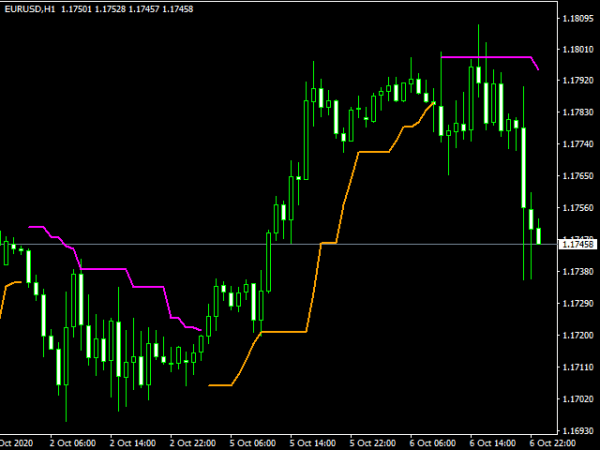
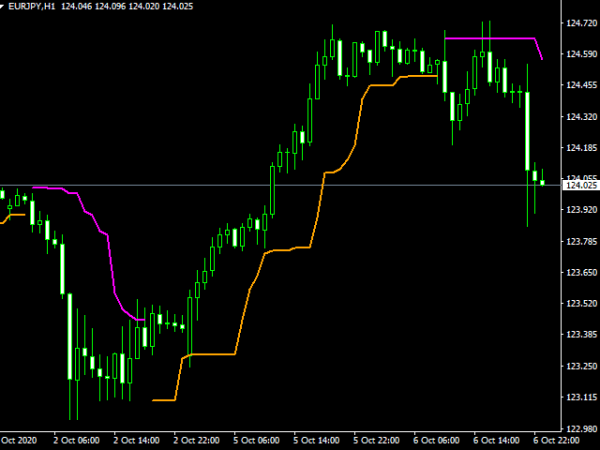
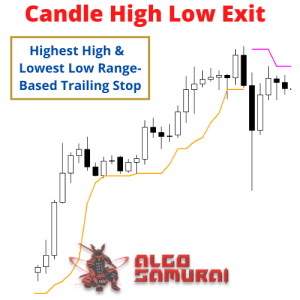
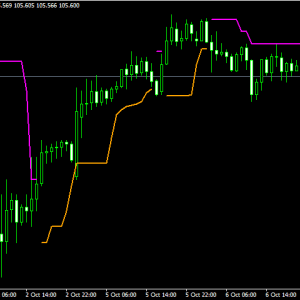
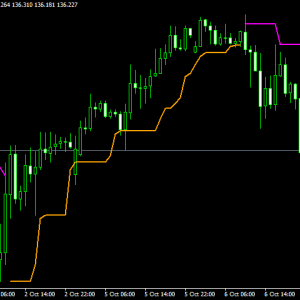
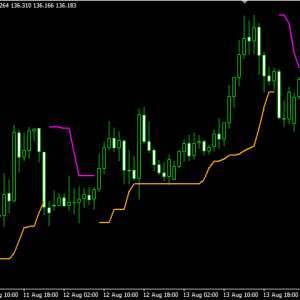
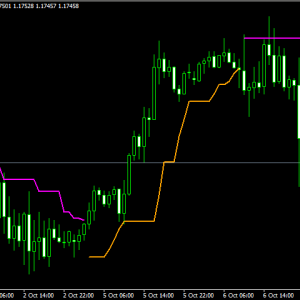
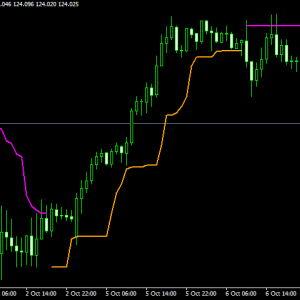
The Candle High Low Exit indicator uses the highest high and the lowest low of a range to draw trailing stop lines (orange under buys, magenta over sells) that advance with the trend until the trend changes direction. Moreover, the trailing stop lines are generated to support the order’s trend direction (long or short):
- In an upward trend, the long trailing stop line (orange line under buy) appears and advances upward until the close crosses under the line.
- In a downward trend, the short trailing stop line (magenta over sell) appears and declines until the close crosses over the line.
Free shipping on orders over $50!
- Satisfaction Guaranteed
- No Hassle Refunds
- Secure Payments
Description
The Candle High Low Exit indicator uses the highest high and the lowest low of a range to draw trailing stop lines (orange under buys, magenta over sells) that advance with the trend until the trend changes direction. Moreover, the trailing stop lines are generated to support the order’s trend direction (long or short):
- In an upward trend, the long trailing stop line (orange line under buy) appears and advances upward until the close crosses under the line.
- In a downward trend, the short trailing stop line (magenta over sell) appears and declines until the close crosses over the line.
| Current version: | 1.6 |
| Operating system: | Windows 7/8/10 |
| Published: | 7 October 2020 |
| Trading platform: | MetaTrader 4 |
| Updated: | 18 December 2020 |
Parameters:
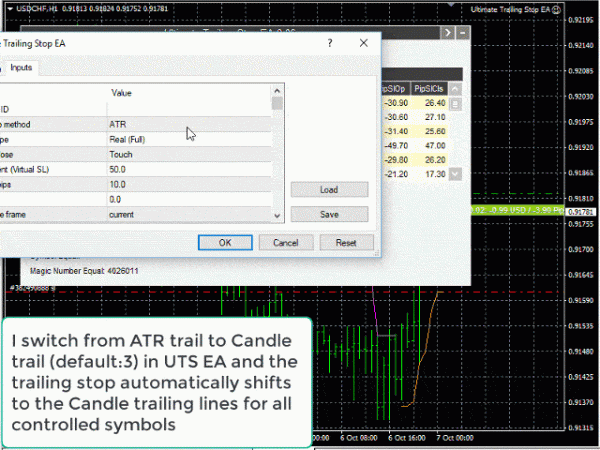
- vesQtCndls (3) – The number of candles for the calculation
Reviews
There are no reviews yet.