-
Sale!
$159.00 Original price was: $159.00.$143.00Current price is: $143.00.
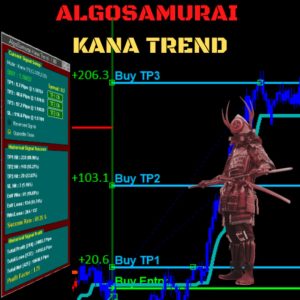
Cutting-edge solution for Trend Trading with statistically robust signals!
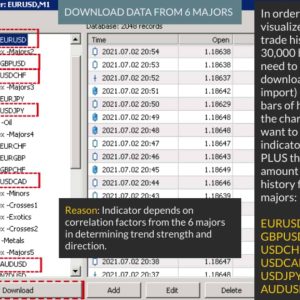
Kana Trend’s smart algorithm detects the trend on any instrument, any timeframe, and gives powerful entry signals with exit levels.
Its advanced statistics gives you deep insight as to success and profitability of its signals — while being fully transparent on any potential for loss.
-

Free

$0.00
Cutting-edge solution for Trend Trading with statistically robust signals!
Kana Trend’s smart algorithm detects the trend on any instrument, any timeframe, and gives powerful entry signals with exit levels.
Its advanced statistics gives you deep insight as to success and profitability of its signals — while being fully transparent on any potential for loss.
-
Free
$0.00
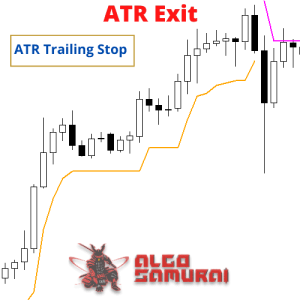
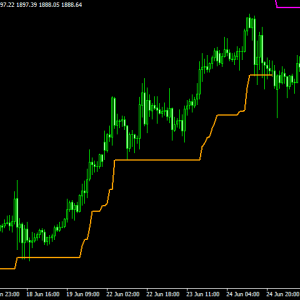
The ATR Exit indicator uses the candle close + ATR value to draw trailing stop lines (orange under buys, magenta over sells) that advance with the trend until the trend changes direction. It uses a multiple of the Average True Range (ATR), subtracting it’s value from the close on buy, adding its value to the close on sell. Moreover, the trailing stop lines are generated to support the order’s trend direction (long or short):
-
- In an upward trend, the long trailing stop line (orange line under buy) appears and advances upward until the close crosses under the line.
- In a downward trend, the short trailing stop line (magenta over sell) appears and declines until the close crosses over the line.
-
Free
$0.00
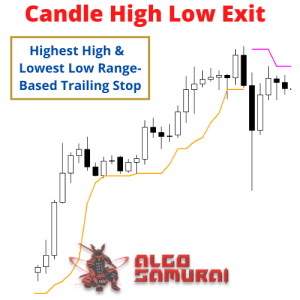
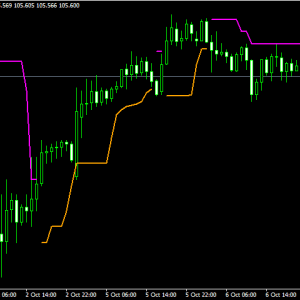
The Candle High Low Exit indicator uses the highest high and the lowest low of a range to draw trailing stop lines (orange under buys, magenta over sells) that advance with the trend until the trend changes direction. Moreover, the trailing stop lines are generated to support the order’s trend direction (long or short):
- In an upward trend, the long trailing stop line (orange line under buy) appears and advances upward until the close crosses under the line.
- In a downward trend, the short trailing stop line (magenta over sell) appears and declines until the close crosses over the line.
-
Free
$0.00
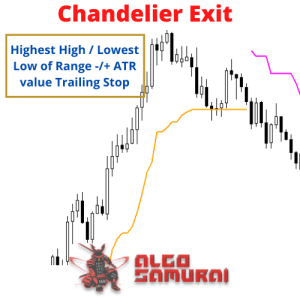
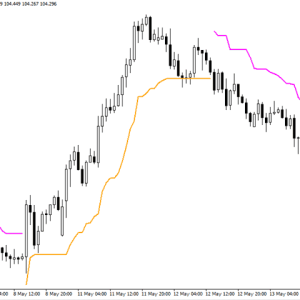
Developed by Chuck LeBeau, the Chandelier Exit indicator uses the highest high / lowest low -/+ a multiple of the ATR value to draw trailing stop lines (orange under buys, magenta over sells) that advance with the trend until the trend changes direction. The value of this trailing stop is that it rapidly moves upward in response to the market action. LeBeau chose the chandelier name because “just as a chandelier hangs down from the ceiling of a room, the chandelier exit hangs down from the high point or the ceiling of our trade.”
Chandelier Exit uses a multiple of the Average True Range (ATR), subtracting it’s value from the highest high on buy, adding its value to the lowest low on sell. Moreover, the trailing stop lines are generated to support the order’s trend direction (long or short):
- In an upward trend, the long trailing stop line (orange line under buy) appears and advances upward until the close crosses under the line.
- In a downward trend, the short trailing stop line (magenta over sell) appears and declines until the close crosses over the line.


