Chandelier Exit
$0.00
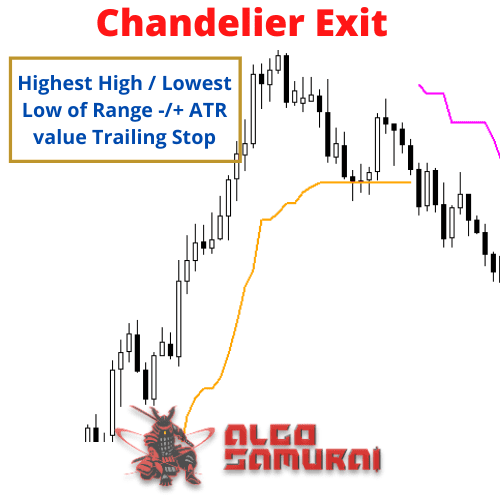
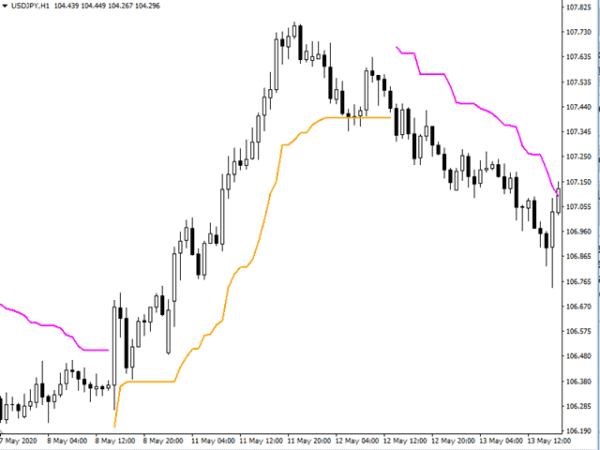
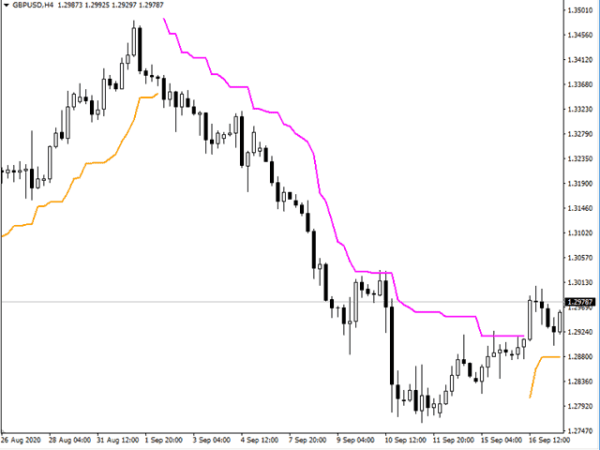
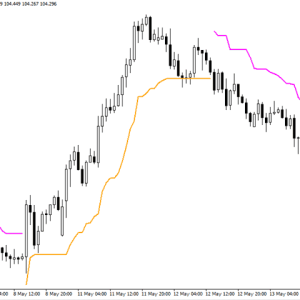
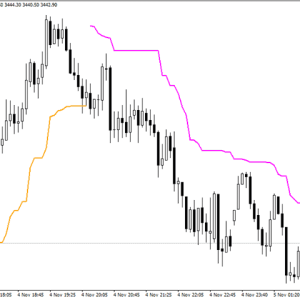
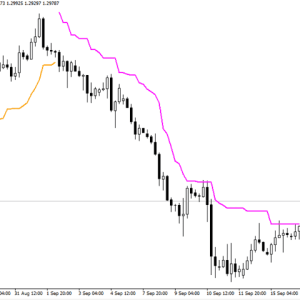
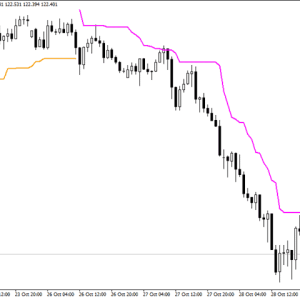
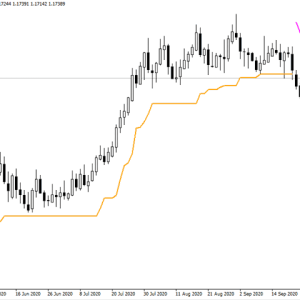
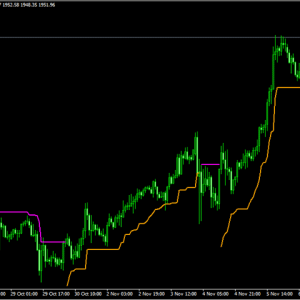
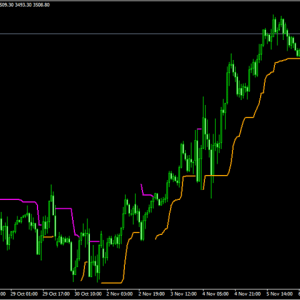
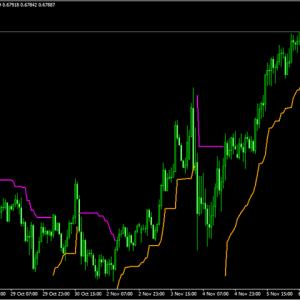
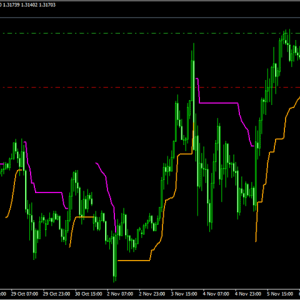
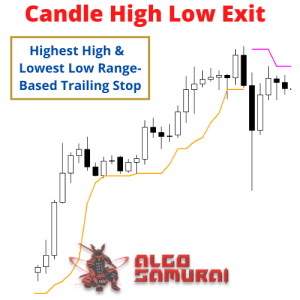
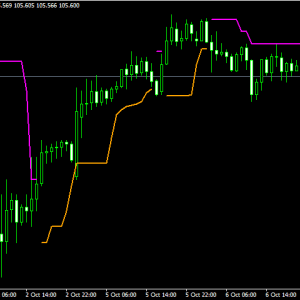
Developed by Chuck LeBeau, the Chandelier Exit indicator uses the highest high / lowest low -/+ a multiple of the ATR value to draw trailing stop lines (orange under buys, magenta over sells) that advance with the trend until the trend changes direction. The value of this trailing stop is that it rapidly moves upward in response to the market action. LeBeau chose the chandelier name because “just as a chandelier hangs down from the ceiling of a room, the chandelier exit hangs down from the high point or the ceiling of our trade.”
Chandelier Exit uses a multiple of the Average True Range (ATR), subtracting it’s value from the highest high on buy, adding its value to the lowest low on sell. Moreover, the trailing stop lines are generated to support the order’s trend direction (long or short):
- In an upward trend, the long trailing stop line (orange line under buy) appears and advances upward until the close crosses under the line.
- In a downward trend, the short trailing stop line (magenta over sell) appears and declines until the close crosses over the line.
Free shipping on orders over $50!
- Satisfaction Guaranteed
- No Hassle Refunds
- Secure Payments
Description
Developed by Chuck LeBeau, the Chandelier Exit indicator uses the highest high / lowest low -/+ a multiple of the ATR value to draw trailing stop lines (orange under buys, magenta over sells) that advance with the trend until the trend changes direction. The value of this trailing stop is that it rapidly moves upward in response to the market action. LeBeau chose the chandelier name because “just as a chandelier hangs down from the ceiling of a room, the chandelier exit hangs down from the high point or the ceiling of our trade.”
Chandelier Exit uses a multiple of the Average True Range (ATR), subtracting it’s value from the highest high on buy, adding its value to the lowest low on sell. Moreover, the trailing stop lines are generated to support the order’s trend direction (long or short):
- In an upward trend, the long trailing stop line (orange line under buy) appears and advances upward until the close crosses under the line.
- In a downward trend, the short trailing stop line (magenta over sell) appears and declines until the close crosses over the line.
While we use the Chandelier Exit as a trailing stop, it can be used in a volatility breakout strategy. The trader or EA can buy whenever the close crosses above the upper trail line and sell whenever the close crosses below the lower trail line.
This Chandelier Exit trail is superior to using a fixed percentage because its change is based on the volatility characteristics of the underlying instrument and time frame.
- Find trends with this Chandelier Exit indicator
- Can work with trending mode or band mode
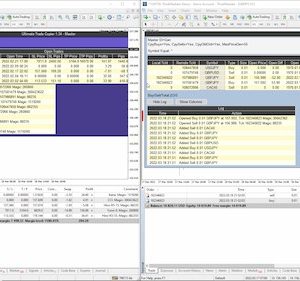
- Can be used as one of the trailing stops for Ultimate Trailing Stop EA
| Current version: | 1.8 |
| Operating system: | Windows 7/8/10 |
| Published:7 | 16 November 2020 |
| Trading platform: | MetaTrader 4 |
| Updated: | 18 December 2020 |
Parameters:
- Range (7) – Range of the highest high (lowest low)
- Shift (1) – Indicator shift;
- ATRPeriod (14) – Indicator Period;
- ATRMultipl (3) – This is the factor for multiplying the ATR. You may use fractions – this does not need to be an integer;




Reviews
There are no reviews yet.